Market Outlook
January 15, 2018
Market Cues
Domestic Indices
Chg (%)
(Pts)
(Close)
Indian markets are likely to open positive tracking global indices and SGX Nifty.
BSE Sensex
0.3
89
34,592
US stocks showing a strong move to the upside in last trading session, stocks
Nifty
0.3
30
10,681
remained firmly positive throughout the afternoon. With the upward move, the major
Mid Cap
(0.2)
(31)
18,137
averages once again climbed to new record closing highs. The Dow Jones jumped
Small Cap
0.0
9
19,993
to 0.9% to close at 25,803 and the Nasdaq Composite edged up to 0.7%, to 7,261.
Bankex
0.5
146
29,098
U.K. shares were moving in a narrow range as oil prices dipped and GKN had
rejected a takeover bid from Melrose Industries. The FTSE 100 was up by 0.2% to
Global Indices
Chg (%)
(Pts)
(Close)
close at 7,779.
Dow Jones
0.9
228
25,803
Nasdaq
0.7
49
7,261
On domestic front, Indian shares hit fresh record highs although overall gains
remained modest ahead of Infosys Q3 earnings and readings on consumer inflation
FTSE
0.2
16
7,779
and industrial output due later in the day. The Sensex ended on an upside front of
Nikkei
0.3
66
23,720
0.3% at 34,592 while the Nifty ended at 10,681 with an upside of 0.3%.
Hang Seng
0.8
239
31,651
Shanghai Com
0.1
2
3,431
News Analysis
Result Review: Infosys (CMP: `1,076 / TP: / Upside :)
Advances / Declines
BSE
NSE
TCS Partners with Transamerica to Digitally Transform its Life and Annuities
Advances
1,345
761
Business
Declines
1,592
1,047
IDFC Bank, Capital First set to merge
Unchanged
152
49
Detailed analysis on Pg2
Volumes (` Cr)
Investor’s Ready Reckoner
BSE
5,391
Key Domestic & Global Indicators
NSE
38,117
Stock Watch: Latest investment recommendations on 150+ stocks
Refer Pg5 onwards
Net Inflows (` Cr)
Net
Mtd
Ytd
Top Picks
FII
(523)
1,639
1,639
CMP
Target
Upside
Company
Sector
Rating
*MFs
725
1,457
1,457
(`)
(`)
(%)
Blue Star
Capital Goods Accumulate
789
867
10.0
Dewan Housing Finance
Financials
Buy
613
712
16.1
Top Gainers
Price (`)
Chg (%)
Asian Granito
Other
Accumulate
610
651
6.7
Den
133
20.0
Navkar Corporation
Other
Buy
216
265
22.7
Rtnpower
8
17.1
KEI Industries
Capital Goods Accumulate
406
436
7.3
Gppl
160
9.6
More Top Picks on Pg4
Welcorp
170
7.5
Key Upcoming Events
Tv18Brdcst
66
6.7
Previous
Consensus
Date
Region
Event Description
Reading
Expectations
Jan15
India
Monthly Wholesale Prices YoY%
3.93
4.00
Top Losers
Price (`)
Chg (%)
Jan15
India
Imports YoY%
19.60
Dishtv
78
(6.6)
Jan15
India
Exports YoY%
30.60
Bajajhind
17
(4.6)
Jan15
UK
CPI (YoY)
3.10
Jan16
Euro Zone
Euro-Zone CPI (YoY)
1.40
Rcom
31
(4.3)
More Events on Pg7
Marksans
47
(3.6)
Swanenergy
205
(3.6)
As on January 12, 2018
Market Outlook
January 15, 2018
News Analysis
Result Review: Infosys (CMP: `1,076 / TP: / Upside :)
For 3QFY2018, the company ended up delivering results just in line on the US$
revenue front, while it delivered better than expected on the volume growth front.
The volume growth, which came in at 1.6% QoQ, consequently aided the EBIT
and PAT coming in higher than expected. During 3QFY2018, company posted a
1.0% sequential growth in US$ revenues to US$2,755mn, in line with expectations.
On constant Currency (CC) terms, the company posted a 0.8% qoq. In rupee
terms, revenues came in at `17,794cr a qoq growth of 1.3% qoq. Volume growth
during the quarter was 1.6% qoq. The volume growth at onsite was 0.4% qoq,
while the offshore volume growth during the quarter was 2.2% qoq.
In terms of geography, North America posted a 0.7% CC growth, Europe posted a
4.7% qoq CC growth, India posted a 5.9% qoq CC growth and ROW posted a
4.0% qoq CC growth. In terms of Industry, FSI posted a 0.1% qoq CC growth,
MFG posted a decline of 0.1% qoq CC growth, RCL posted a 1.2% qoq CC
growth and ECS posted a 2.5% qoq CC growth.
On operating front, the EBITDA margins came in at 24.3% V/s 24.2% expected
with an uptick of 10bp qoq, on back of good volume growth and consequently
better employee (excluding trainees) utilization rate of
84.9% V/s 84.7% in
2QFY2018. Attrition (annualized consolidated) during the quarter was 18.7% V/s
21.4% in 2QFY2018. Consequently, PAT came in at `3,697cr, de-growth of 0.8%
qoq. Reported PAT came in at `5,129cr V/s `3,726cr a qoq growth of 37.6%. The
reported PAT came in higher on back of the Tax reversal on back of the APA with
US internal Revenue Service. The reported tax reversal amount has been at
`1,432cr.
In terms of client addition, the company added 7 clients overall. It added, 3 in the
US$75mn+, one in US$50mn and one in US$100mn+. Overall, the client
additions were strong across the board and the active clients during the quarter
was 1191. The Management guidance for the year has remained same at 5.5-
6.5% sales growth of in constant currency (CC) terms, while EBIT margins are
expected to come in at 23-25%. We maintain our neutral stance on the stock.
Y/E
Sales OPM
PAT
EPS ROE P/E P/BV EV/EBITDA EV/Sales
March
(` cr)
(%)
(` cr)
(`)
(%)
(x)
(x)
(x)
(x)
FY2017E
70,333
26.0
14,169
61.7
18.9
17.5
3.3
10.5
2.7
FY2018E
75,960
26.0
15,125
65.9
18.7
16.4
3.1
9.5
2.5
Market Outlook
January 15, 2018
TCS Partners with Transamerica to Digitally Transform its Life and
Annuities Business
Tata Consultancy Services (TCS) announced that it has entered into an agreement
with Transamerica, a leading provider of life insurance, retirement and investment
solutions, to enable the transformation of administration of its U.S. insurance &
annuity business lines. The partnership enables Transamerica to rapidly enhance
its digital capabilities, simplify the service of more than 10 million policies into a
single integrated modern platform, and drive greater sustainable growth
opportunities through superior customer experiences. The agreement, a multi-year
partnership with more than US$2bn of revenues to TCS and is expected to be
completed by the second quarter 2018. Thus, the deal will fully reflect in FY2019.
The agreement is expected to lead to annual run-rate savings of approximately
US$70mn initially - growing to US$100mn over time - for Transamerica. We
currently maintain our reduce rating on the stock with a price target of `2442.
IDFC Bank, Capital first set to merge
Finally, IDFC bank got the perfect match that can boost retail presence. The
boards of the IDFC Bank Ltd. and Capital First Ltd. on 13/01/18 approved a
merger between the two entities, creating a lender which will have a portfolio
diversified across large corporate lending, small and medium enterprise loans and
retail credit. Shareholders of Capital First will get 139 shares of IDFC Bank for
every 10 held, IDFC Bank said in a statement after its board meeting on Saturday.
The deal values Capital First at a 12% premium to its closing price on Friday.
IDFC bank loan book has more skewed towards infrastructure sector, which
contributing approx. 48% as on Q2FY18. GNPA stands at 3.9%. Whereas 93% of
the loan book of the Capital first is contributed by retail lending and GNPA stood
at 1.63% as on Q2FY18.
Post-merger, the combined entity of IDFC Bank and Capital First will have
1)
An AUM of Rs 88,000cr
2)
A distribution network comprising 194 branches (as per branch count of
December 2017 of both entities),
3)
353 dedicated banking correspondent outlets and over 9,100 micro ATM
points.
Market Outlook
January 15, 2018
Economic and Political News
India gives $45mn aid to develop Kankesanthurai harbour in Sri Lanka
India needs 533mn tones refining capacity by 2040 to meet domestic
demand
Government amends housing scheme guidelines under PMAY to enhance its
coverage.
Corporate News
Reliance planning own cryptocurrency, Akash Ambani to lead project
MMTC plans a full-fledged portal for transaction of gold and silver
Nissan Motors may make budget e-cars in India, cheapest with Rs 700,000
Domestic pharmaceutical sales growth at eight year low, slips to 5.5%
Quarterly Bloomberg Brokers Consensus Estimate
Federal Bank - Jan 15, 2018
Particulars ( `cr)
3QFY18E
3QFY17
y-o-y (%)
2QFY18
q-o-q (%)
PAT
258
205
25.8
263
(1.9)
Market Outlook
January 15, 2018
Top Picks HHHHH
Market Cap
CMP
Target
Upside
Company
Rationale
(` Cr)
(`)
(`)
(%)
Strong growth in domestic business due to its
leade`hip in acute therapeutic segment. Alkem expects
Alkem Laboratories
27,008
2,259
2,441
8.1
to launch more products in USA, which bodes for its
international business.
We expect the company would report strong
Asian Granito
1,835
610
651
6.7
profitability owing to better product mix, higher B2C
sales and amalgamation synergy.
Favorable outlook for the AC industry to augur well for
Cooling products business which is out pacing the
Blue Star
7,563
789
867
10.0
market growth. EMPPAC division's profitability to
improve once operating environment turns around.
With a focus on the low and medium income (LMI)
consumer segment, the company has increased its
Dewan Housing Finance
19,241
613
712
16.1
presence in tier-II & III cities where the growth
opportunity is immense.
Loan growth is likely to pick up after a sluggish FY17.
Lower credit cost will help in strong bottom-line
Karur Vysya Bank
8,903
123
160
30.6
growth. Increasing share of CASA will help in NIM
improvement.
High order book execution in EPC segment, rising B2C
KEI Industries
3,185
406
436
7.3
sales and higher exports to boost the revenues and
profitability
Expected to benefit from the lower capex requirement
Music Broadcast
2,440
428
475
11.1
and 15 year long radio broadcast licensing.
Massive capacity expansion along with rail advantage
Navkar Corporation
3,252
216
265
22.7
at ICD as well CFS augur well for the company
Strong brands and distribution network would boost
Siyaram Silk Mills
3,602
768
813
5.8
growth going ahead. Stock currently trades at an
inexpensive valuation.
Market leadership in Hindi news genre and no. 2
viewership ranking in English news genre, exit from the
TV Today Network
2,778
466
500
7.4
radio business, and anticipated growth in ad spends
by corporate to benefit the stock.
After GST, the company is expected to see higher
volumes along with improving product mix. The
Maruti Suzuki
2,85,777
9,460
10,619
12.2
Gujarat plant will also enable higher operating
leverage which will be margin accretive.
We expect loan book to grow at 24.3% over next two
GIC Housing
2,484
461
655
42.0
year; change in borrowing mix will help in NIM
improvement
We expect CPIL to report net Revenue/PAT CAGR of
~17%/16% over FY2017-20E mainly due to healthy
7,878
355
400
12.8
growth in plywood & lamination business, forayed into
Century Plyboards India
MDF & Particle boards on back of strong brand &
distribution network.
We expect sales/PAT to grow at 13.5%/20% over next
LT Foods
3,309
103
128
23.7
two years on the back of strong distribution network &
addition of new products in portfolio.
We expect sales/PAT to grow at 13%/16% over next
two years on the back of strong healthy demand in
Ruchira Papers
469
209
244
16.8
writing & printing paper and Kraft paper. Further,
China had banned making paper from waste pulp
which would benefit Indian paper companies.
We expect financialisation of savings and increasing
Aditya Birla Capital
40,518
184
230
25
penetration in Insurance & Mutual fund would ensure
steady growth.
Source: Company, Angel Research
Market Outlook
January 15, 2018
Key Upcoming Events
Result Calendar
Date
Company
January 15, 2018
Federal Bank
January 17, 2018
Hindustan Unilever, Zee Electronic, Infratel
Source: Bloomberg, Angel Research
Global economic events release calendar
Bloomberg Data
Date
Time
Country
Event Description
Unit
Period
Last Reported
Estimated
Jan 15, 2018
12:00 PMIndia
Monthly Wholesale Prices YoY%
% Change
Dec
3.93
4.00
India
Imports YoY%
% Change
Dec
19.60
India
Exports YoY%
% Change
Dec
30.60
Jan 16, 2018
3:00 PMUK
CPI (YoY)
% Change
Dec
3.10
Jan 17, 2018
3:30 PMEuro Zone Euro-Zone CPI (YoY)
%
Dec F
1.40
7:45 PMUS
Industrial Production
%
Dec
0.20
0.20
Jan 18, 2018
7:00 PMUS
Housing Starts
Thousands
Dec
1,297.00
1,270.00
7:00 PMUS
Building permits
Thousands
Dec
1,303.00
1,288.00
7:30 AMChina
Industrial Production (YoY)
% Change
Dec
6.10
6.10
7:30 AMChina
Real GDP (YoY)
% Change
4Q
6.80
6.70
Jan 23, 2018
8:30 PMEuro Zone Euro-Zone Consumer Confidence
Value
Jan A
0.50
Jan 24, 2018
2:00 PMGermany PMI Services
Value
Jan P
55.80
8:30 PMUS
Existing home sales
Million
Dec
5.81
5.60
2:00 PMGermany PMI Manufacturing
Value
Jan P
63.30
3:00 PMUK
Jobless claims change
% Change
Dec
5.90
Source: Bloomberg, Angel Research
Market Outlook
January 15, 2018
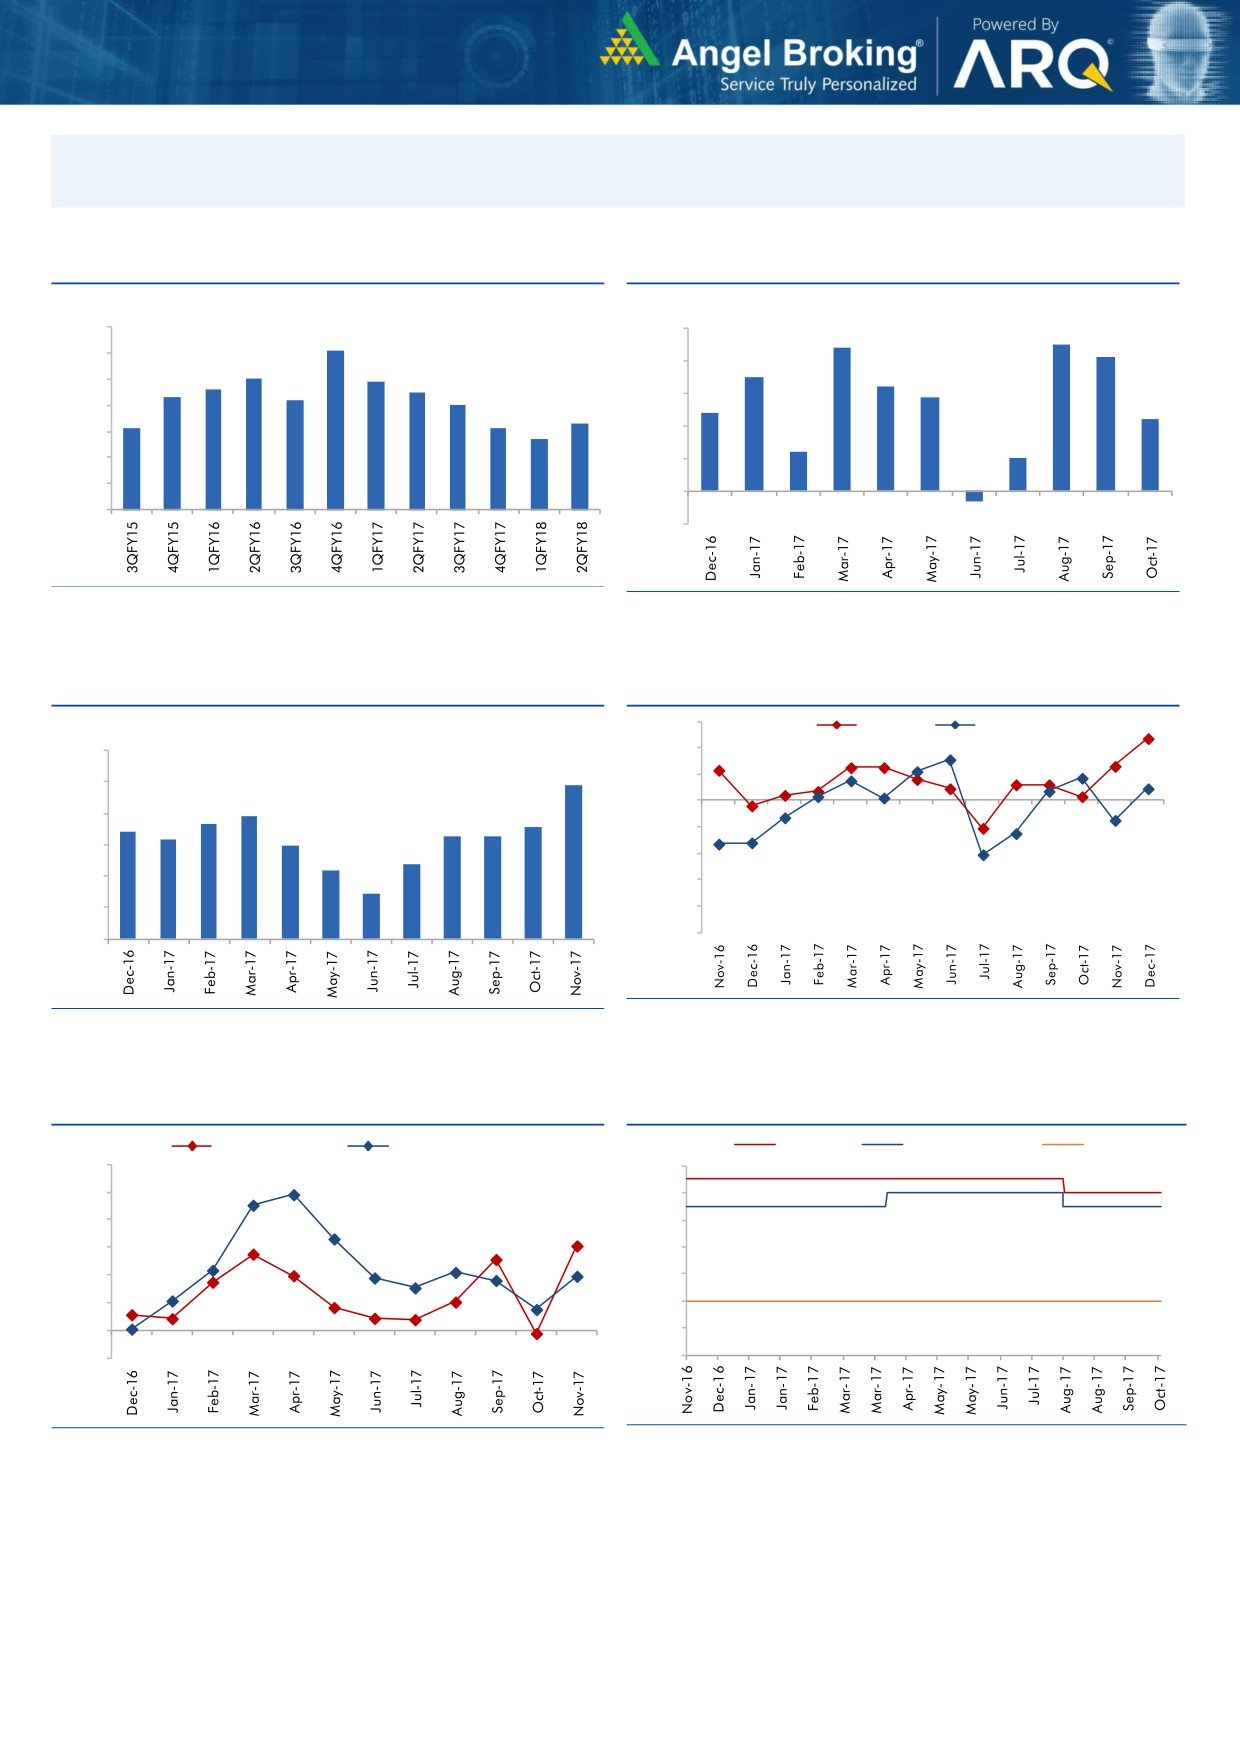
Macro watch
Exhibit 1: Quarterly GDP trends
Exhibit 2: IIP trends
(%)
(%)
10.0
5.0
4.5
9.1
4.4
4.1
9.0
8.0
7.9
4.0
3.5
7.6
7.5
3.2
8.0
7.3
7.2
2.9
7.0
3.0
2.4
7.0
6.3
2.2
6.1
6.1
5.7
2.0
6.0
1.2
1.0
5.0
1.0
4.0
-
3.0
(1.0)
(0.3)
Source: CSO, Angel Research
Source: MOSPI, Angel Research
Exhibit 3: Monthly CPI inflation trends
Exhibit 4: Manufacturing and services PMI
56.0
Mfg. PMI
Services PMI
(%)
6.0
54.0
4.9
52.0
5.0
3.9
50.0
4.0
3.7
3.6
3.4
3.3
3.3
3.2
3.0
48.0
3.0
2.4
2.2
46.0
2.0
1.5
44.0
1.0
42.0
40.0
-
Source: Market, Angel Research; Note: Level above 50 indicates expansion
Source: MOSPI, Angel Research
Exhibit 5: Exports and imports growth trends
Exhibit 6: Key policy rates
(%)
Exports yoy growth
Imports yoy growth
(%)
Repo rate
Reverse Repo rate
CRR
60.0
6.50
50.0
6.00
40.0
5.50
30.0
5.00
20.0
4.50
10.0
4.00
0.0
3.50
(10.0)
3.00
Source: Bloomberg, Angel Research
Source: RBI, Angel Research
Market Outlook
January 15, 2018
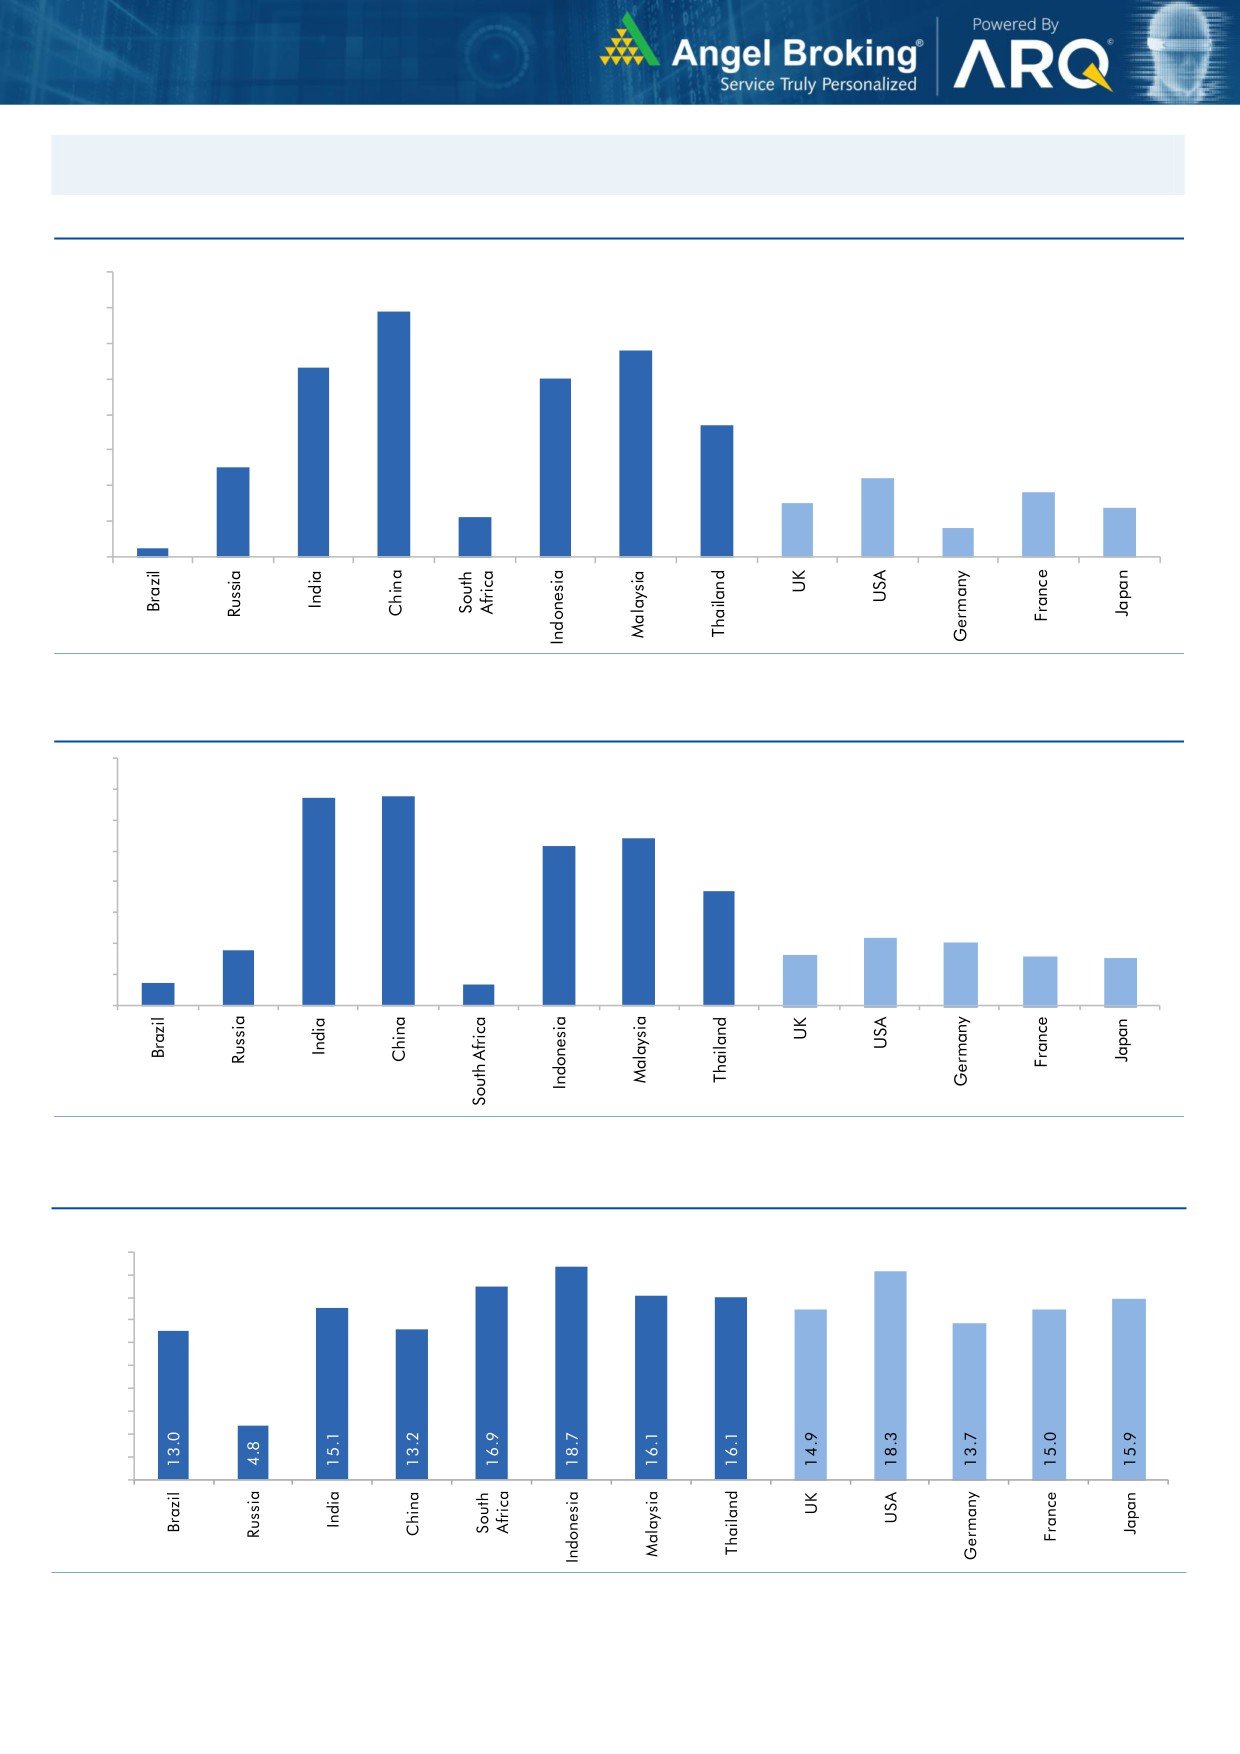
Global watch
Exhibit 1: Latest quarterly GDP Growth (%, yoy) across select developing and developed countries
(%)
8.0
6.9
7.0
5.8
6.0
5.3
5.0
5.0
1.1
3.7
4.0
2.5
3.0
2.2
1.8
2.0
1.5
1.4
0.8
1.0
0.3
-
Source: Bloomberg, Angel Research
Exhibit 2: 2017 GDP Growth projection by IMF (%, yoy) across select developing and developed countries
(%)
6.7
6.8
7.0
6.0
5.4
5.2
5.0
3.7
4.0
3.0
1.8
2.2
2.0
1.7
1.6
2.0
0.7
1.5
0.7
1.0
-
Source: IMF, Angel Research
Exhibit 3: One year forward P-E ratio across select developing and developed countries
(x)
20.0
18.0
16.0
14.0
12.0
10.0
8.0
6.0
4.0
2.0
-
Source: IMF, Angel Research
Market Outlook
January 15, 2018
Exhibit 4: Relative performance of indices across globe
Returns (%)
Country
Name of index
Closing price
1M
3M
1YR
Brazil
Bovespa
79,349
9.1
3.6
27.8
Russia
Micex
2,262
7.5
8.4
2.3
India
Nifty
10,681
4.3
5.8
28.9
China
Shanghai Composite
3,429
3.9
1.6
8.4
South Africa
Top 40
53,296
3.1
3.6
16.5
Mexico
Mexbol
49,136
3.3
(1.9)
6.7
Indonesia
LQ45
1,083
6.3
10.9
28.1
Malaysia
KLCI
1,823
6.0
3.5
10.6
Thailand
SET 50
1,176
6.8
9.1
19.9
USA
Dow Jones
25,803
5.8
12.8
29.8
UK
FTSE
7,779
5.2
3.2
6.2
Japan
Nikkei
23,654
5.1
14.7
21.2
Germany
DAX
13,245
0.7
2.3
13.9
France
CAC
5,517
2.2
2.9
13.7
Source: Bloomberg, Angel Research p68in4
Market Outlook
January 15, 2018
Research Team Tel: 022 - 39357800
DISCLAIMER
Angel Broking Private Limited (hereinafter referred to as “Angel”) is a registered Member of National Stock Exchange of India
Limited,Bombay Stock Exchange Limited and Metropolitan Stock Exchange Limited. It is also registered as a Depository Participant with
CDSL and Portfolio Manager with SEBI. It also has registration with AMFI as a Mutual Fund Distributor. Angel Broking Private Limited is a
registered entity with SEBI for Research Analyst in terms of SEBI (Research Analyst) Regulations, 2014 vide registration number
INH000000164. Angel or its associates has not been debarred/ suspended by SEBI or any other regulatory authority for accessing
/dealing in securities Market. Angel or its associates/analyst has not received any compensation / managed or
co-managed public offering of securities of the company covered by Analyst during the past twelve months.
This document is solely for the personal information of the recipient, and must not be singularly used as the basis of any investment
decision. Nothing in this document should be construed as investment or financial advice. Each recipient of this document should make
such investigations as they deem necessary to arrive at an independent evaluation of an investment in the securities of the companies
referred to in this document (including the merits and risks involved), and should consult their own advisors to determine the merits and
risks of such an investment.
Reports based on technical and derivative analysis center on studying charts of a stock's price movement, outstanding positions and
trading volume, as opposed to focusing on a company's fundamentals and, as such, may not match with a report on a company's
fundamentals. Investors are advised to refer the Fundamental and Technical Research Reports available on our website to evaluate the
contrary view, if any.
The information in this document has been printed on the basis of publicly available information, internal data and other reliable
sources believed to be true, but we do not represent that it is accurate or complete and it should not be relied on as such, as this
document is for general guidance only. Angel Broking Pvt. Limited or any of its affiliates/ group companies shall not be in any way
responsible for any loss or damage that may arise to any person from any inadvertent error in the information contained in this report.
Angel Broking Pvt. Limited has not independently verified all the information contained within this document. Accordingly, we cannot
testify, nor make any representation or warranty, express or implied, to the accuracy, contents or data contained within this document.
While Angel Broking Pvt. Limited endeavors to update on a reasonable basis the information discussed in this material, there may be
regulatory, compliance, or other reasons that prevent us from doing so.
This document is being supplied to you solely for your information, and its contents, information or data may not be reproduced,
redistributed or passed on, directly or indirectly.
Neither Angel Broking Pvt. Limited, nor its directors, employees or affiliates shall be liable for any loss or damage that may arise from
or in connection with the use of this information.